Mobile performance testing with SmartQE using Jmeter
SmartQE, a containerized Cloud based SaaS framework along with Opensource performance testing tool (JMeter) help in measuring the mobile user’s experience (Video Streaming) and “backend request and response” during impacted network and server load conditions.
SmartQE provides virtual devices, connected via Wi-Fi or cellular carriers to the internet, and spread in different locations. SmartQE enables virtual mobile device testing on simulated network and server load conditions.
This solution enables users to measure response time and availability of key transactions inside a mobile application, under simulated real-world conditions. This new product handles this complex and challenging process composed of unpredictable network conditions and varying server loads, alongside mobile device performance under such conditions.
 Setup Pre-Requisites
Following are the Pre-requisites required to setup performance test bed
RequiredAcquired from SmartQE Support:
Mobile account, including required devices that are connected to the network virtualization component via Wi-Fi
Mobile Automation License
OthersApache Jmeter
Examine network conditions impact on mobile user experience. Network conditions includes the following components:
Creating a Mobile Automation script
Network conditions commands
Create a Mobile Automation script, within the SmartQE. Once your script is ready, follow the steps below to customize it to Mobile Monitoring.
Step 1. Identify the KPIs to be measured.
These are the Key Performance indicators (KPIs) you are interested in monitoring. A KPI is a measurement of response time and availability of a user facing transaction. It can be composed of a single or multiple user action(s)
Step 2. Measure each KPI
Define a timer starting point for each KPI. Use the Timer start function one line before the desired command line. Do this for each KPI you want to measure.
Step 3. Insert a condition into the script
Place a Condition (Text checkpoint or image checkpoint) following the timer and command being measured.
Step 4. Terminate the timer on condition success
Place a Timer stop function within the condition On Success.
If the condition is successful, the timer value will be reported, facilitating the response time of the aspect of the KPI.
If the condition fails, the timer will not be reported, thus facilitating the availability aspect of the KPI.
Step 5. Insert two timer checkpoints
Place a Time checkpoint, and use the ‘Elapsed’ timer to measure.
Place a Time checkpoint, and use the ‘System’ timer to measure.
Step 6.Exit the script on condition failure (Optional)
You may want to close the device(s) and exit the script by placing an Exit function within the condition On failure.
Step 7.Add network virtualization commands
Network virtualization start
Network virtualization update
Network virtualization stop
The below Mobile Automation functions drive the network conditions.
Network virtualization start – Start network virtualization for the device with the specified conditions
Network virtualization update – Update network virtualization for the device with the specified conditions; for any condition that is not specified, the system will continue to use the existing value
Network virtualization stop – Stop network virtualization for the device and save PCAP file to the repository
Use the above Network virtualization start and the Network virtualization update commands to activate and update the network conditions. Without this activation there is no effect on the device communication to the Web.
| Network | Latency | Packet loss | Bandwidth in | Bandwidth out |
|---|---|---|---|---|
| 3G | 75 ms | 0% | 780 Kbps | 330 Kbps |
| Edge | 200 ms | 0% | 100 Kbps | 100 Kbps |
| LTE | 40 ms | 0% | 10000 Kbps | 7500 Kbps |
| DSL | 25 ms | 0% | 2000 Kbps | 256 Kbps |
| 100% Loss | 0 ms | 100% | 10000 Kbps | 1000 Kbps |
| Very Bad Network | 500 ms | 10% | 1000 Kbps | 1000 Kbps |
| Name | Mandatory | Type | Default | Description |
|---|---|---|---|---|
| Device ID | Handset | DUT | The device for this command. | |
| Latency | Optional | Number | 0 | Latency applied on packets in the Network. Effective values are in the range of 0-8000 ms. |
| Packet loss | Optional | Number | 0 | Network packet loss. Effective values are in the range of 0-90%. |
| Bandwidth in | Optional | Number | unlimited | Limitation on the allowed bandwidth into the device in the network. Effective values are in the range of 3- 100,000Kbps, or unlimited. |
| Bandwidth out | Optional | Number | unlimited | Limitation on the allowed bandwidth from the device in the network. Effective values are in the range of 3- 100,000Kbps, or unlimited. |
Examine server load impact on mobile user experience. This section includes the following components:
- Creating a Jmeter script to simulate the server load
- Creating a Jmeter wrapper for the real mobile device
- Best practices for configuring real device testing within Jmeter
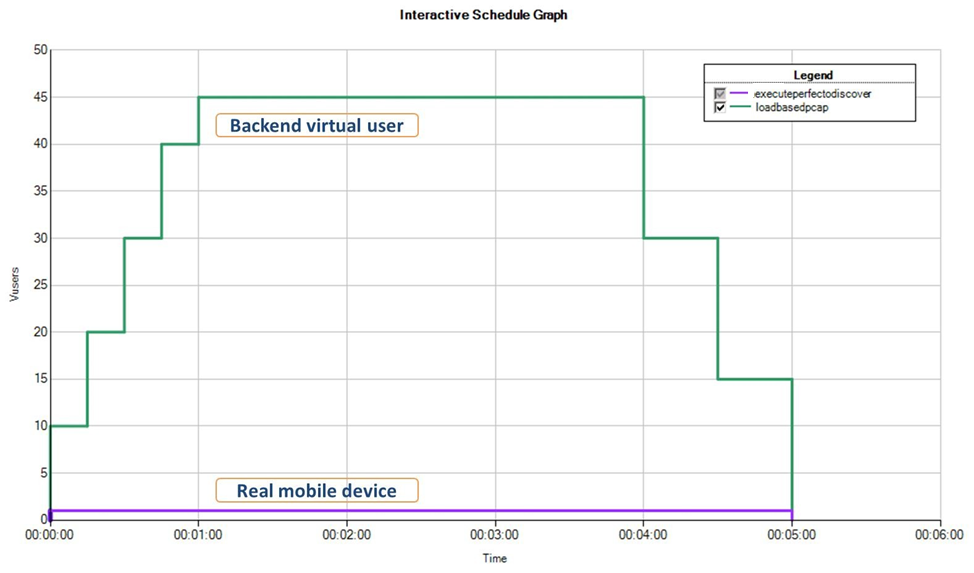
- Apply a significant number of virtual users on the backend
- The script representing these virtual users may already exist or may be generated from a previous recording of the device traffic as it communicates with the service.
- Execute a real device test and measure KPIs, in parallel, on a sample set of devices
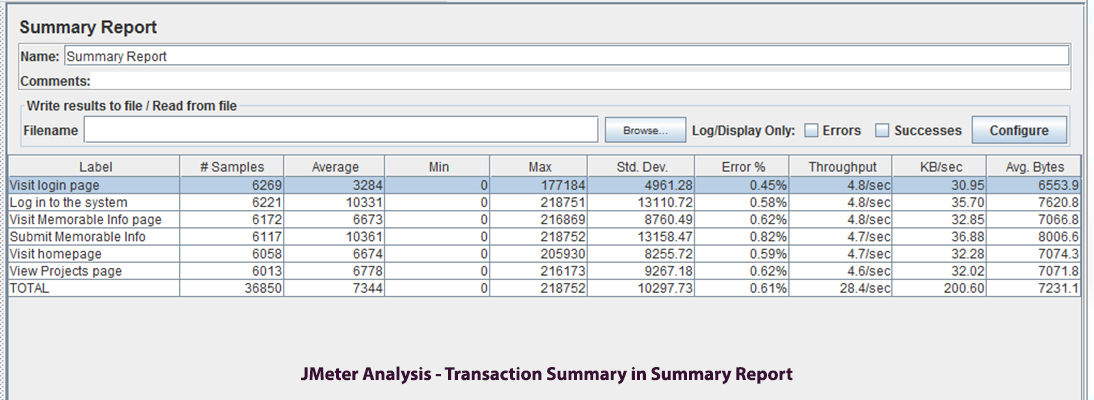
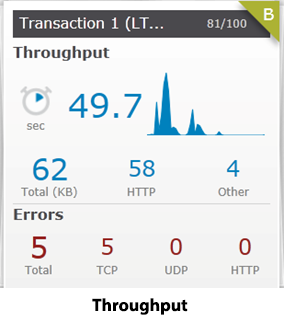
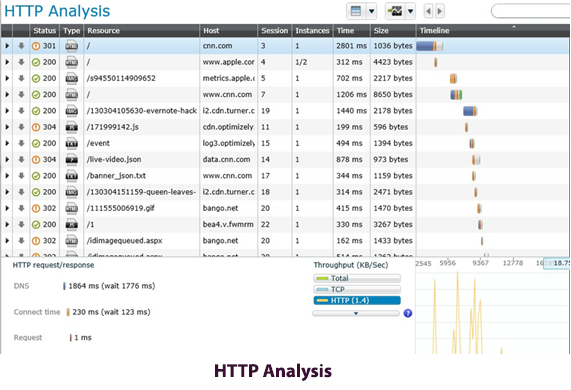
JMeter present reporting for both approaches, as well as the script execution result for each device from SmartQE.
Creating a Jmeter script from the PCAP file to facilitate the backend server load
This step is optional and only required if there is no existing backend load traffic script available; Use the PCAP file generated in the previous section, and import it into Jmeter.
Step 1.Open Jmeter
Step 2.Go to New Script
Step 3.Analyze the traffic using the PCAP file
Step 4.Browse to the PCAP file location to be used to generate a script
Step 5.Specify the IP address of the host, observed during the PCAP recording No file is generated if the IP address specified here does not match what is in the file. If you've forgotten what the IP addresses are, use a PCAP file reader utility (Wireshark) to view the file
Step 6.. Click Finish to complete the process and generate the Jmeter script
Create a JMeter wrapperThe JMeter script includes HTTP API operations that communicate with the Mobile.
This section describes all the components necessary to customize your JMeter script; including broken down descriptions of a Jmeter script. Customize the following three components
- Customize Mobile Parameters
- Customize Transactions (KPIs)
- Customize Timers
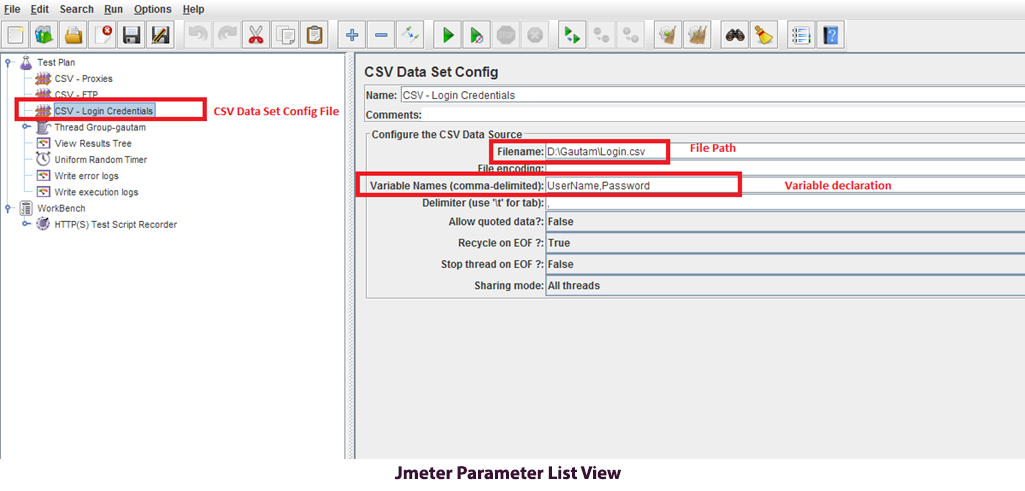
Define the following list of Mobile parameters in the Jmeter parameter settings. Click on each parameter to update its value.
- Base Url
- User name and Password
- Device OS, Location, Model, Carrier
Modify the transaction names as per the requirement
The JMeter script reads the timers script execution report (i.e. xml file generated post completion of script execution), and passes those values with the correct KPI names.
JMeter sample script components.
- Get Available Device: Query Mobile for available devices to run the Automation script
- Execute Mobile Automation Script: Send an execution query to the Mobile MCM to execute the Automation script
- Check Mobile Automation Script Execution Status: Query the Mobile for the Automation script execution status – loop querying every 30 seconds until execution is complete. It also describes how to implement multiple timers and KPIs.
This first step facilitates device availability via redundancy. Mobile monitoring requires a minimum of two devices deployed in order to assure device availability.
Define device characteristics in the JMeter script parameters (“Iphone”, “Boston”, “AT&T”). These will be used to request the device according to these characteristics and select the first available device in the response
Once an available device has been selected and defined, it is possible to send an execution request to the Mobile.
Collect and Analyze Mobile Script run Report, Once the Mobile Automation script has completed, it is possible to retrieve the script report in XML format, extract the timer(s) availability and value, and report this data.
To get the Application vitals, go to Device vitals information > Settings and select an application.
| Performance Metrics | Description |
| CPU Kernel | Percentage usage of CPU by the operating system |
| CPU Total | Total CPU Usage |
| CPU User | Percentage usage of the CPU by the operating system |
| Memory Cache | Ram memory that holds frequently used data to increase processing power |
| Memory Free | Unused memory |
| Memory Used | Used memory |
| Network in data | Bytes received from the mobile network |
| Network out data | Bytes sent to the mobile network |
| Network in Wifi | Bytes received from the wireless network |
| Network out Wifi | Bytes sent to the wireless network |
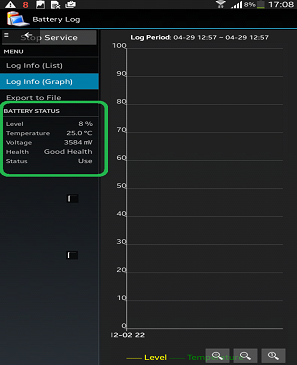
Capture Battery Time using Battery Log for Android
You may want to create several scripts that will run on different devices while the emulated load is in effect. Ensure the followings for each script:
Only one virtual user is applied at all times
For the duration of the load test, repeat the script execution on the real device
JMeter user manual for instructions on viewing load session reports. If the load session was completed successfully, you should be able to obtain KPIs from real devices that are materially different from those extracted by the emulated load.
Refer to the reporting interface inside portal to view specific real device script execution report.